
Monday Update 6/08
8 Bearish Charts; 2 Bullish Charts
Today was exactly what I was hoping for (check the pic below 👇). The Inside Bar on NVDA and QQQ shows a rational response to the massive down day on Friday. Often times, we see an Inside Bar after a massive trend day. To negate that flush, we’d need to see some overwhelming volume. We did not get that today. We got consolidation.
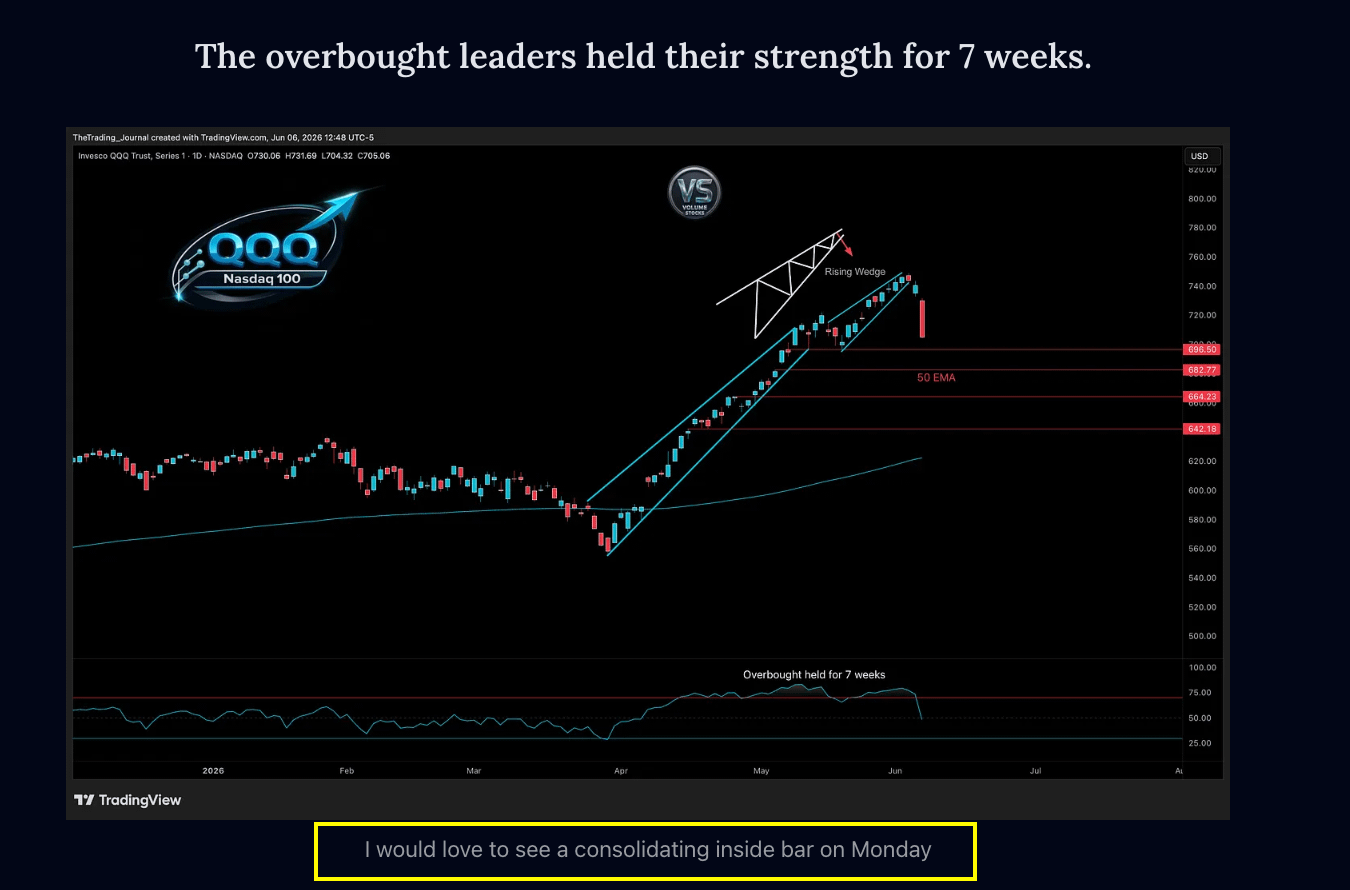
This is what we saw today; a consolidating Inside Bar.

On the technical side, this favors a further pullback. AMZN AAPL agree.

AMZN was shared over the weekend. I’m in on Puts. My stop is at 249.5 (just above today’s high). This has all the looks of a chart that wants to test the 200 EMA.
AAPL is turning over as well. Could bullish news come at any time? Yes, we can’t control the news, but we can pay attention to the Leaders. These Megas can have a strong influence on the rest of the market. We need to watch them. A re-test of 308.50 could provide a nice opportunity for Puts.

This is a system I use 👇. You are free to use or adapt.
🗒️ None of my charts are a plan to jump in blindly. They are all binary conditionals; trigger + confirmation + 🎯= 🏆.
White lines are Support/Resistance I’m watching (I set my alert 🚨 there)
IF the 🚨 is triggered, I check for confirmation.
IF the trigger loses support, I am out (My 🛑 is always on the other side of my thesis). Why have a thesis if I don’t follow it?
Red lines are 🎯s where I scale out(then I set my 🛑 to guarantee a winning trade)
What is an A+ setup to me? (Explained here)
I share charts; not financial advice. What you do with this info is up to you.
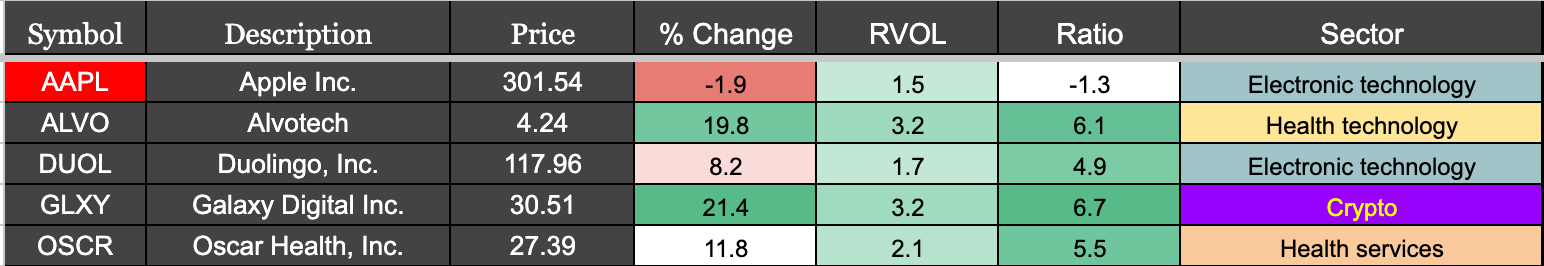
My Current Top 8 🗓️
Note: If you’re looking for more charts, check out my X Feed (Link). If you’re looking for a contrarian bullish setup, check out MNDY here. You will notice below that I don’t see the best risk/reward on the Long Side in the market. When I noticed the pops being sold last week, my shift started going towards the down side. I am bullish on 1 stock though. More on that below.
🎬 MS; Morgan Stanley 🏦 🐻
Thesis: Double Inside Bar at the top of an Ascending Channel
Could this go up? Absolutely. In recent months, that’s exactly the kind of market we’ve seen. However, if I’m ever looking to go long on a setup, it is not at this point. I’m looking for potential reversals. 211.42 will help us. Today was hardly strong.
🔁 Note: I will use this emoji to indicate if I am still swinging 🔁
🎬 I will use the “begin” emoji to show if I’m looking to start a new position

What’s the Bear Case Here?
This is Mainly a Technical Setup. It has been Overbought for weeks and is now showing RSI Bearish Divergence. In Ascending Channels, I watch for a reversal📉
Fee and pricing pressure on “human” advice: As AI tools and robo-like capabilities get better at portfolio construction, planning, and basic advice, clients may resist paying full‑fat advisory fees for services that are automated
Job and cost disruption risk: MS itself and its peers expect AI to eliminate a meaningful share of banking jobs by automating middle/back‑office and tasks
🔁 My personal plan: If it confirms < 211.42 🚨, I will Swing 6/18 Puts (205 strikes)
Subscribe to see my Top 10. The Discord Link is at the bottom of the Newsletter. I provide Updates on Weekends, Mondays, Wednesdays (that’s 3 times each week w/ 8 charts). Included in the subscription are all my Candlestick Courses, Thread Updates, and a link to my Volume Journal.
Keep reading with a 7-day free trial
Subscribe to Volume Stocks LLC to keep reading this post and get 7 days of free access to the full post archives.